
Smith chart is used be mysterious to me. My daughter has an interesting book named my heart is like a zoo. This makes me come up with the story – my circle is like a Smith chart.

I can find lots of reference on Smith chart online, among which one of the most useful one is explained by Prof. F. Delssperger and he also develops a handy software to help us with matching and etc. After reading his slides, I kind of understand that Smith chart is trying to combine the impedance in Z plane with the reflection coefficient in Polar diagram. However, I am still confused about the exact size and position of the circles until I happen to find this derivation.
I extract the main flow of derivations here. For details, please click the above link.
First, the reflection coefficient is a complex number.

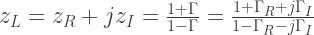
Second, this coefficient corresponds directly to a specific impedance as seen at the point it is measured. It can be calculated based on a load impedance ZL (using a reference impedance Z0). And the load impedance is further normalized to the reference impedance zL=ZL/Z0.

Third, the normalized load impedance, which is also a complex number, can be expressed by the reflection coefficient.
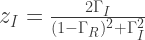
Fourth, after rationalizing, the normalized load resistance zR and load reactance zI can be expressed by the following two circle equations.

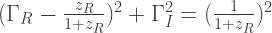
Finally, thanks to the author’s derivation, the equations of the two circle can be rewritten in a familiar format.
For normalized load resistance:

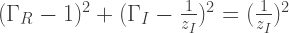
For normalized load reactance:

Now we can draw some circles on Smith chart.

